Historical Reports
Within the Historical Reports TAB you can build, schedule, share and export historical reports without any restrictions on time period. YTD, QTD, MTD and numerous other relative time filters. Export in excel (.xlxs), share with private URL’s and ConnectPath’s instant messaging.
Create Report
At the top right corner of the dashboard you can click the Create Report button to build an historical report.
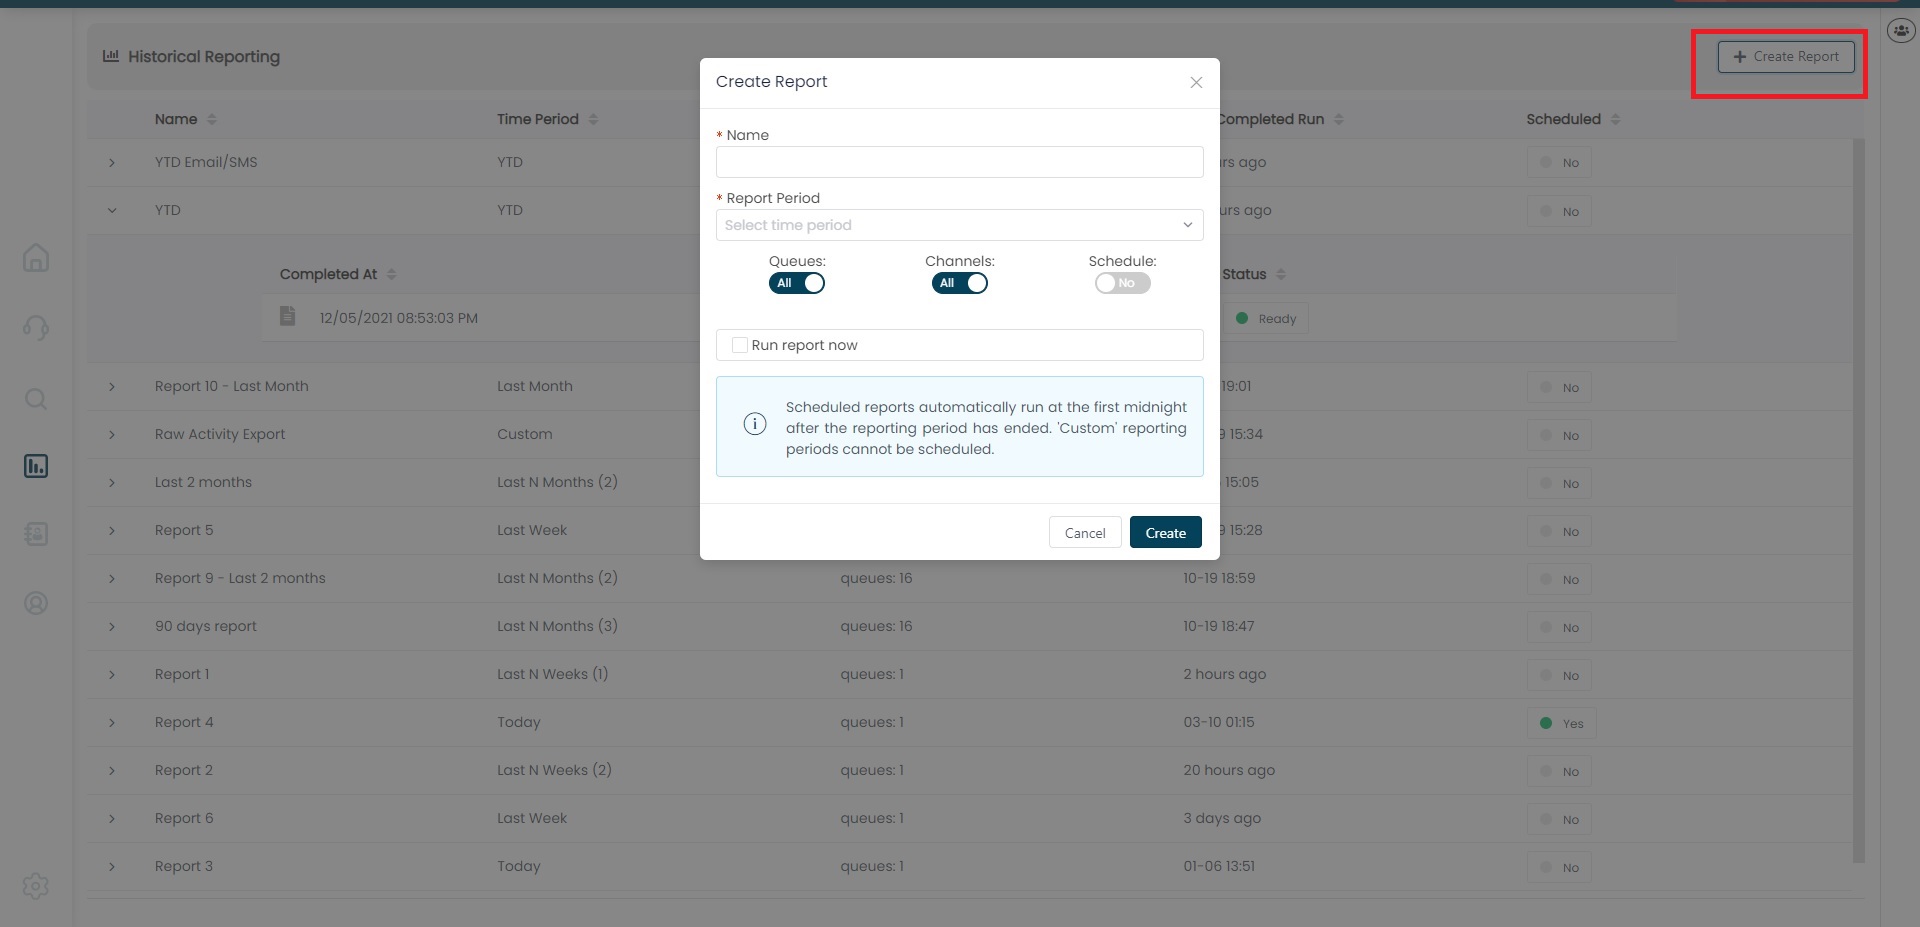
Fill out the Name, Report Period input fields, and click on the Run report now button. You can also filter reports by Queues.
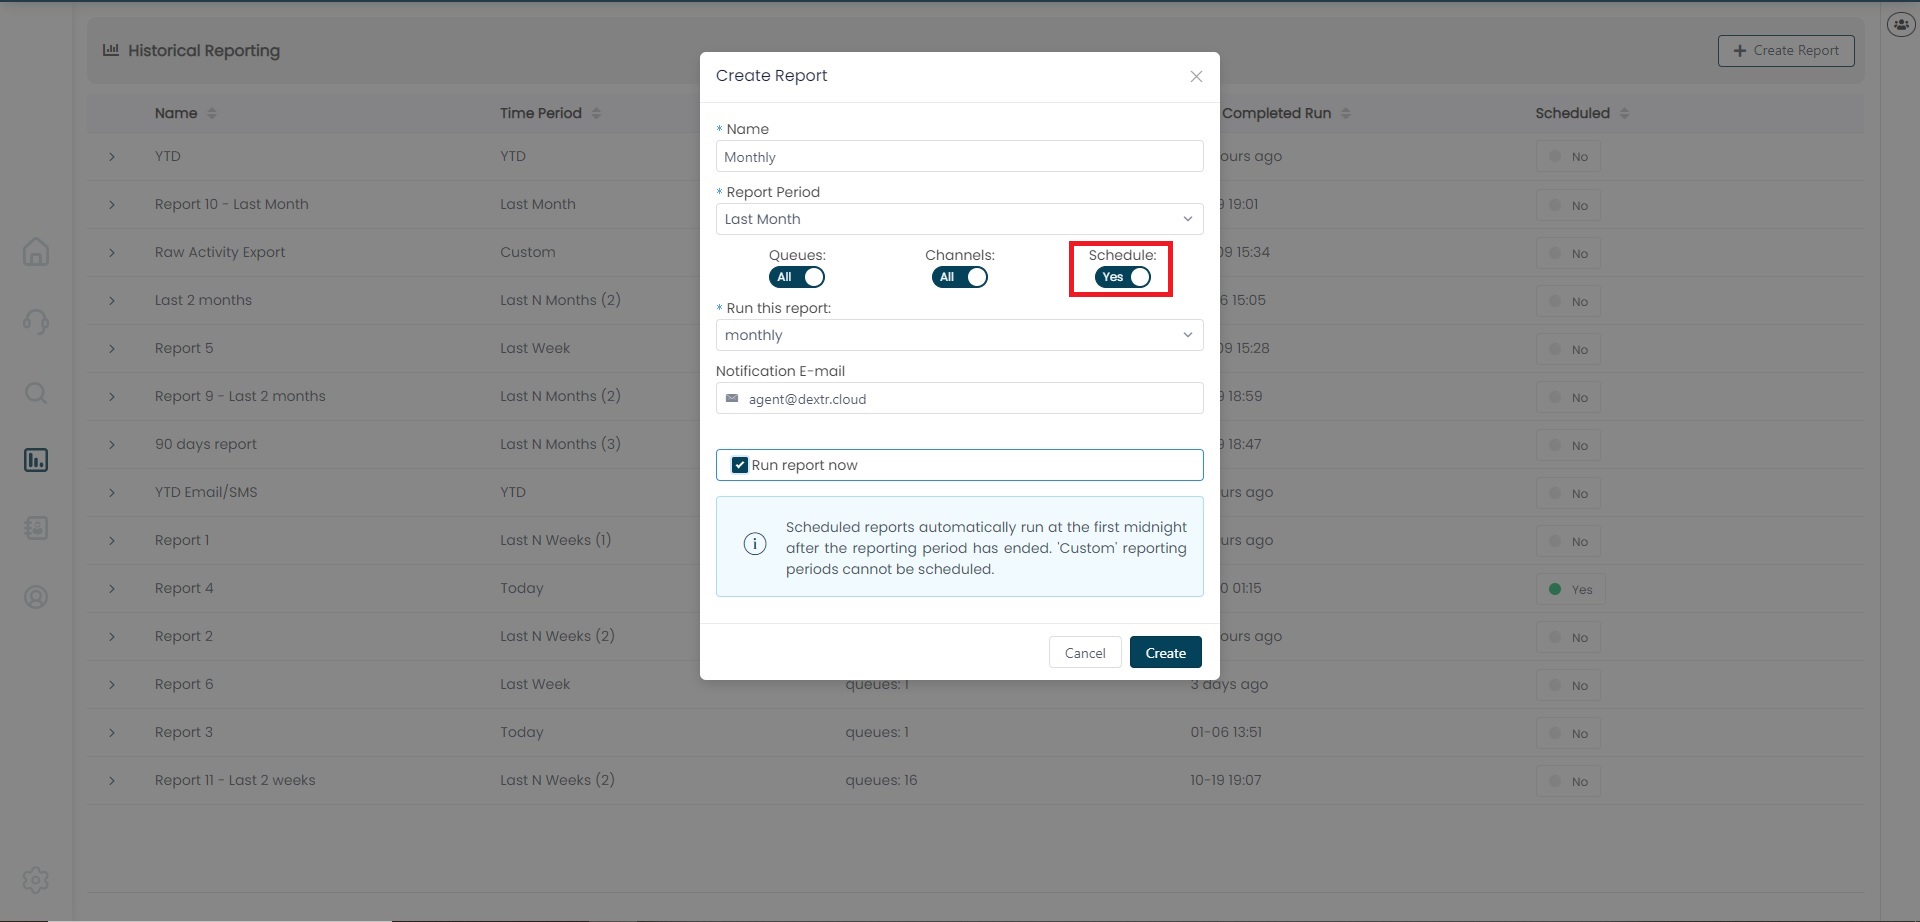
Schedule Report
You can also Schedule the release of reports (by day, week, month) and set up the delivery of these by sending a notification to an Email.
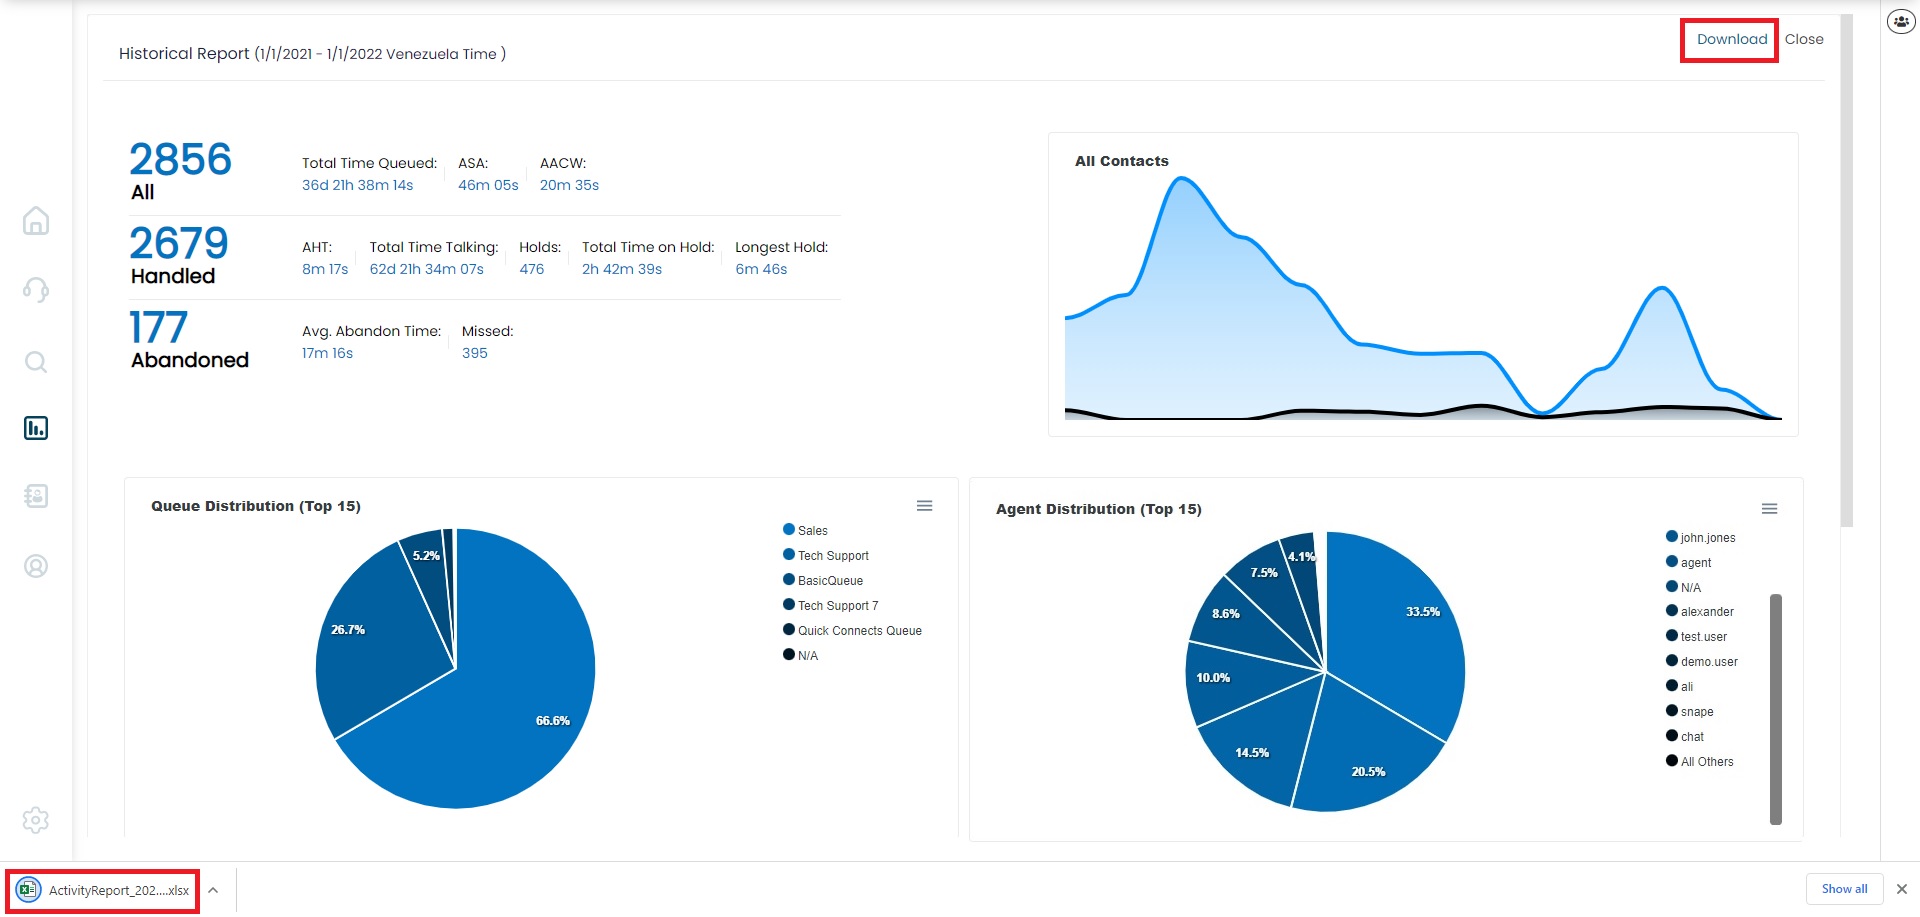
Report Dashboard
At the top side of the page you can see different details (Timezone, Report time period) and both a Download and Close button. The report also displays a summary table with general metrics: All, Handled, Abandoned, Total Time Queued, ASA, AACW, AHT, Total Time Talking, Holds, Total Time on Hold, Longest Hold, Avg. Abandon Time and Missed.
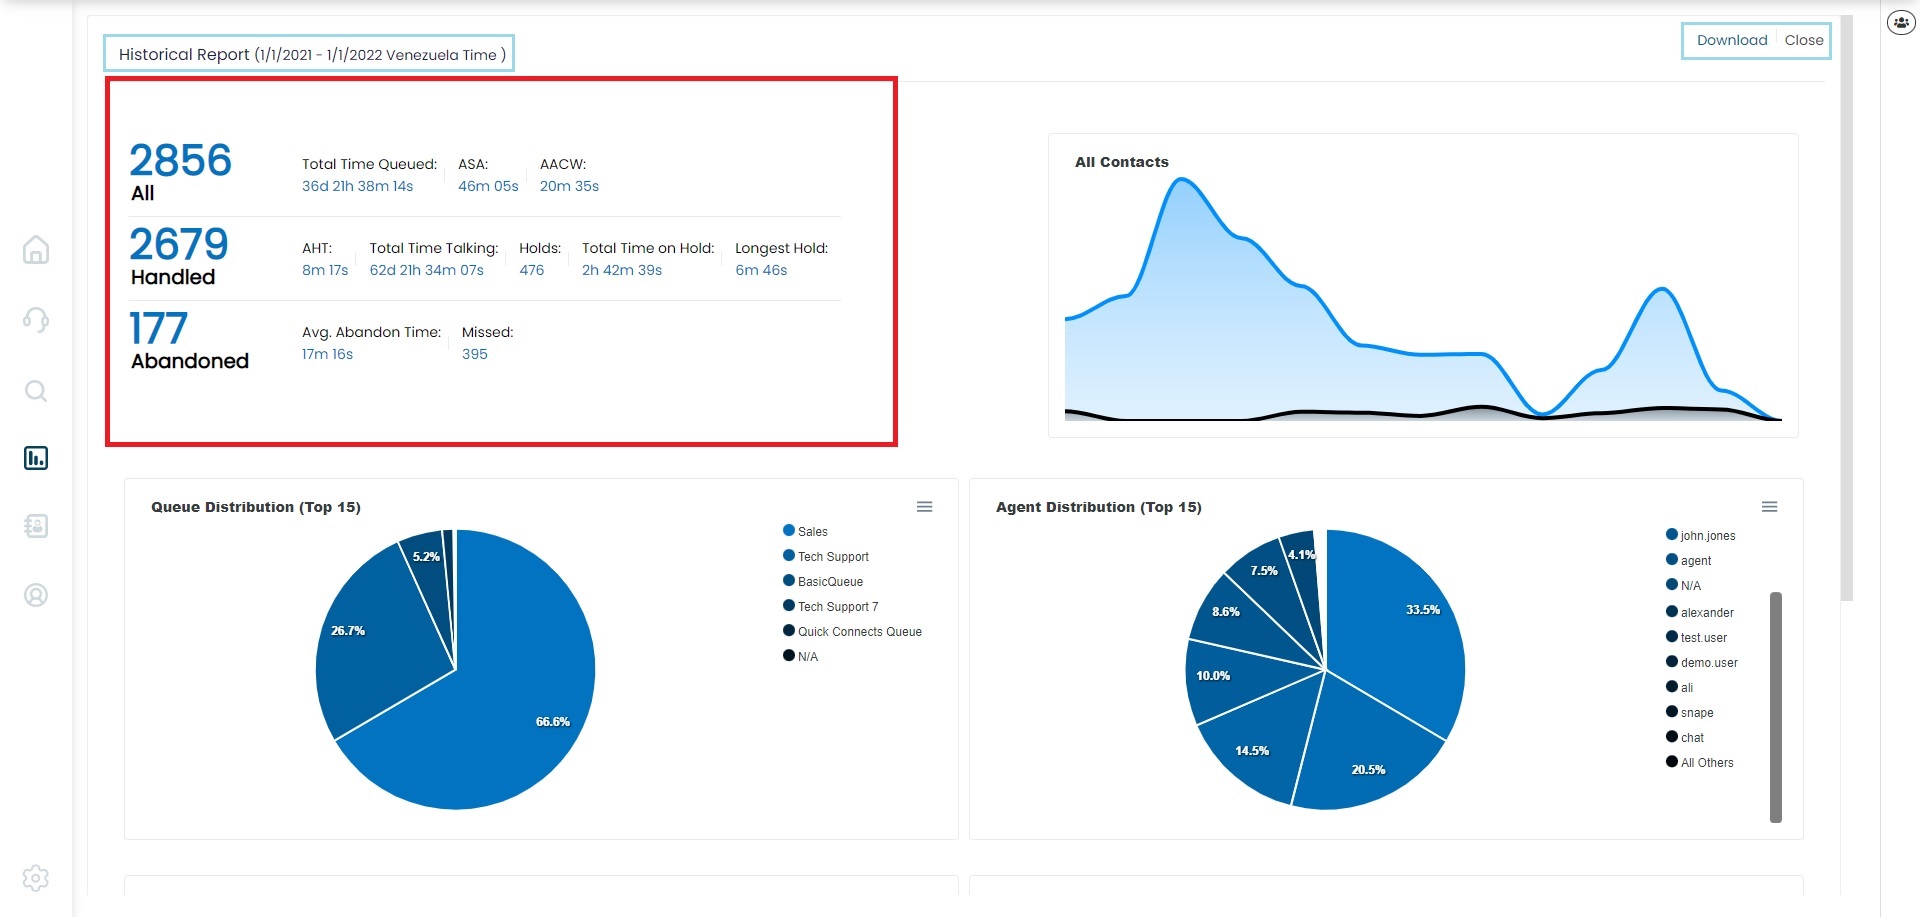
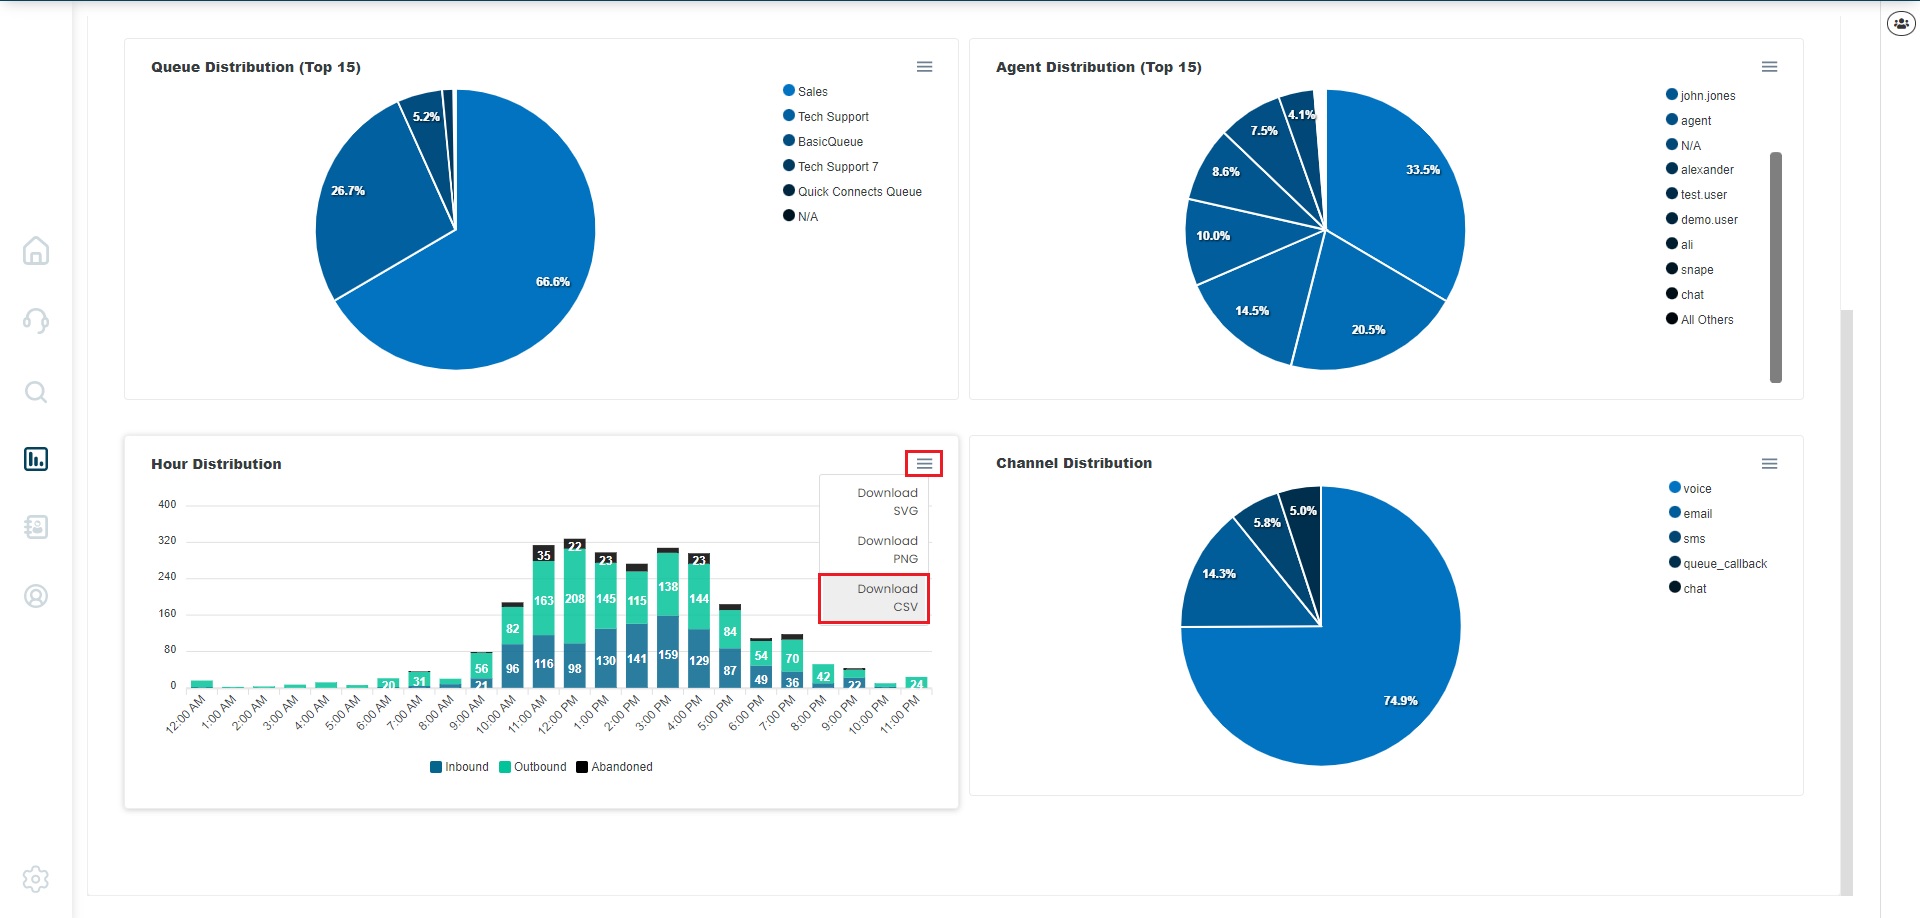
Charts - All, Queue, Agent, Hour and Channel Distribution
These are charts displaying the amount of contacts the instance has perceived between a set of different metrics (number of contacts handled by queue, agent, contacts within an specific hour…) in the selected period of time. Each of these has the option to be downloaded either as a csv, svg, or png file.
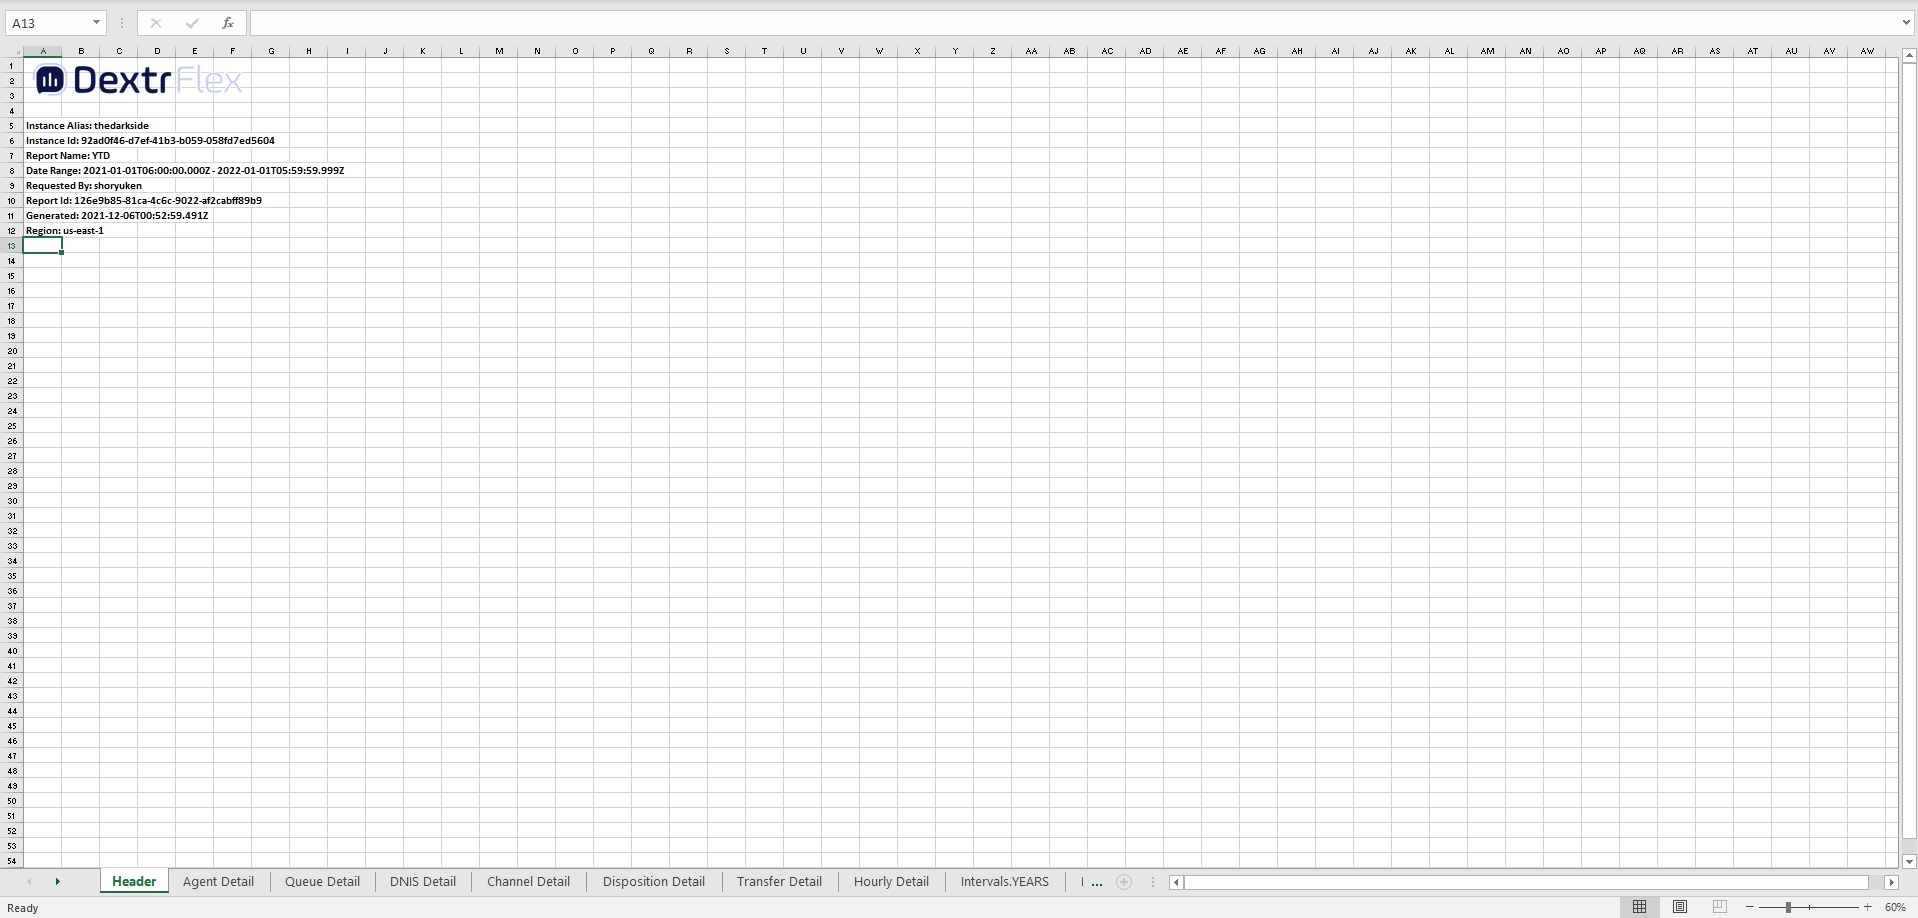
Dowload - Excel file
By clicking the download button you get the excel file which depicts in greater detail the values of each chart and metric.