ConnectPath Home
First Look
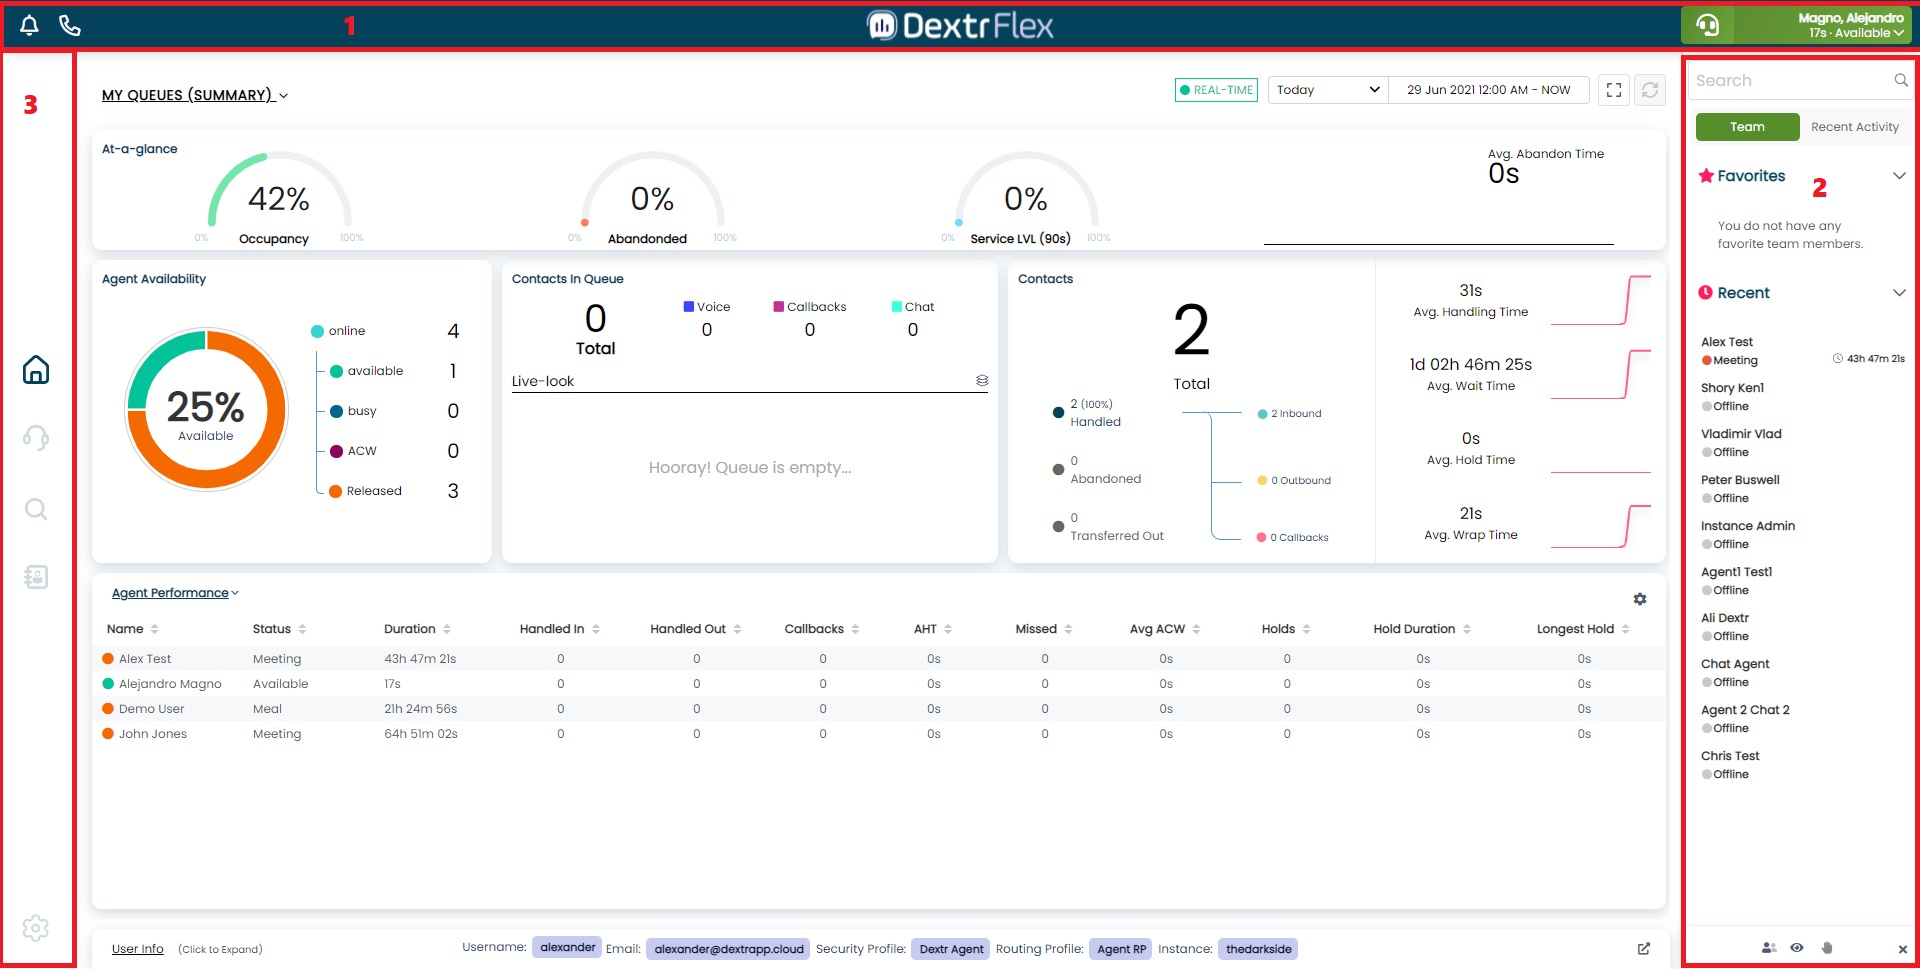
After you enter the ConnectPath dashboard you can see at the top of the screen the header (Component 1), the Team Status Drawer (Component 2) in the right corner, and in the left corner a Side Navigation bar (Component 3).
Header
The header is a global section of ConnectPath that will always be on display. You’ll see your Agent Status, a Handset, a Bell and the Instance logo.
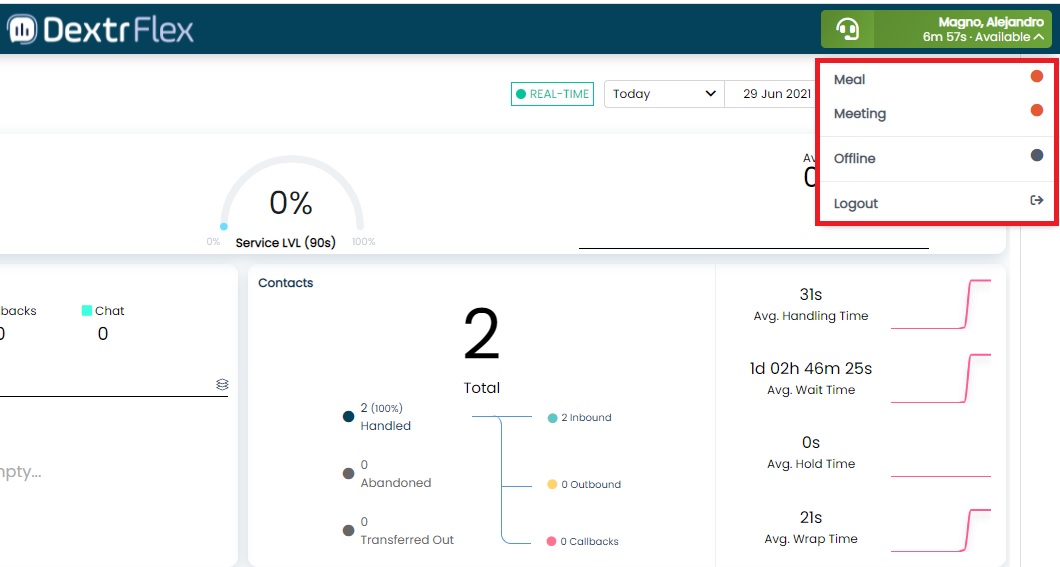
Agent Status
Every ConnectPath Instance has 2 status for you to select after being onboarded: Available and Offline. By default your status is set to Offline on login, so remember to change your status from Offline to Available to be able to receive calls. If you see Forced Released as a status is because you missed an incoming call.
Your ConnectPath Administrator may also enable other status for you to select and to be seen by your teammates.
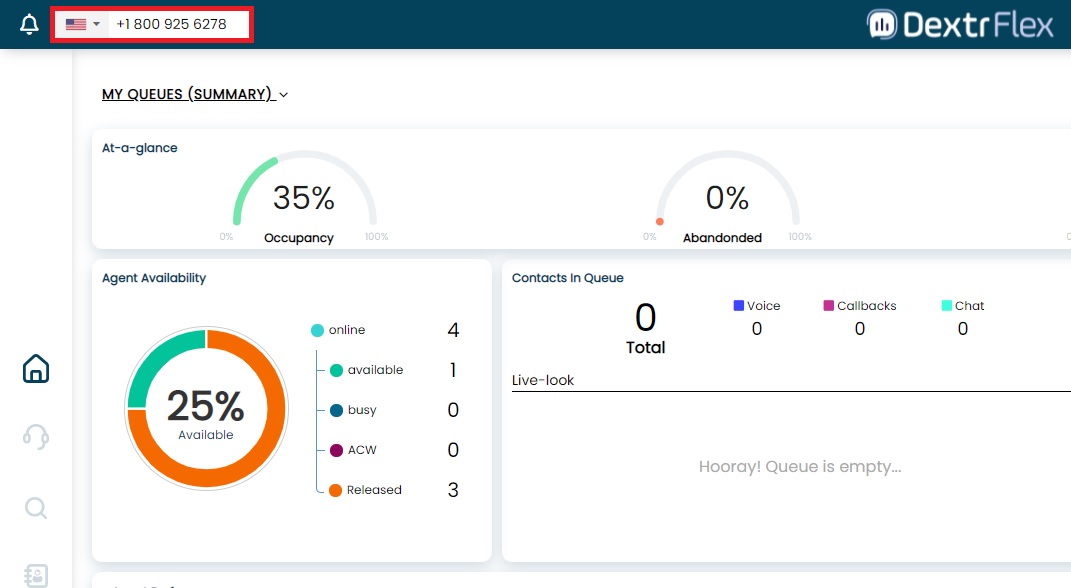
Quick Dial
The Handset is for quick dial and you can input a phone number to make a call. After a call is made, the quick dial will record the recent calls made by you and you’ll have a dropdown with the phone numbers in it. Remember to choose the proper flag for calling.
Announcements
By clicking the Bell icon in the header, you’ll open the Announcements. Here you can see all the announcements related to your queue. If you’re an admin, you’re able to post announcements by clicking the pencil icon in the bottom side, or delete them by clicking the trash icon.
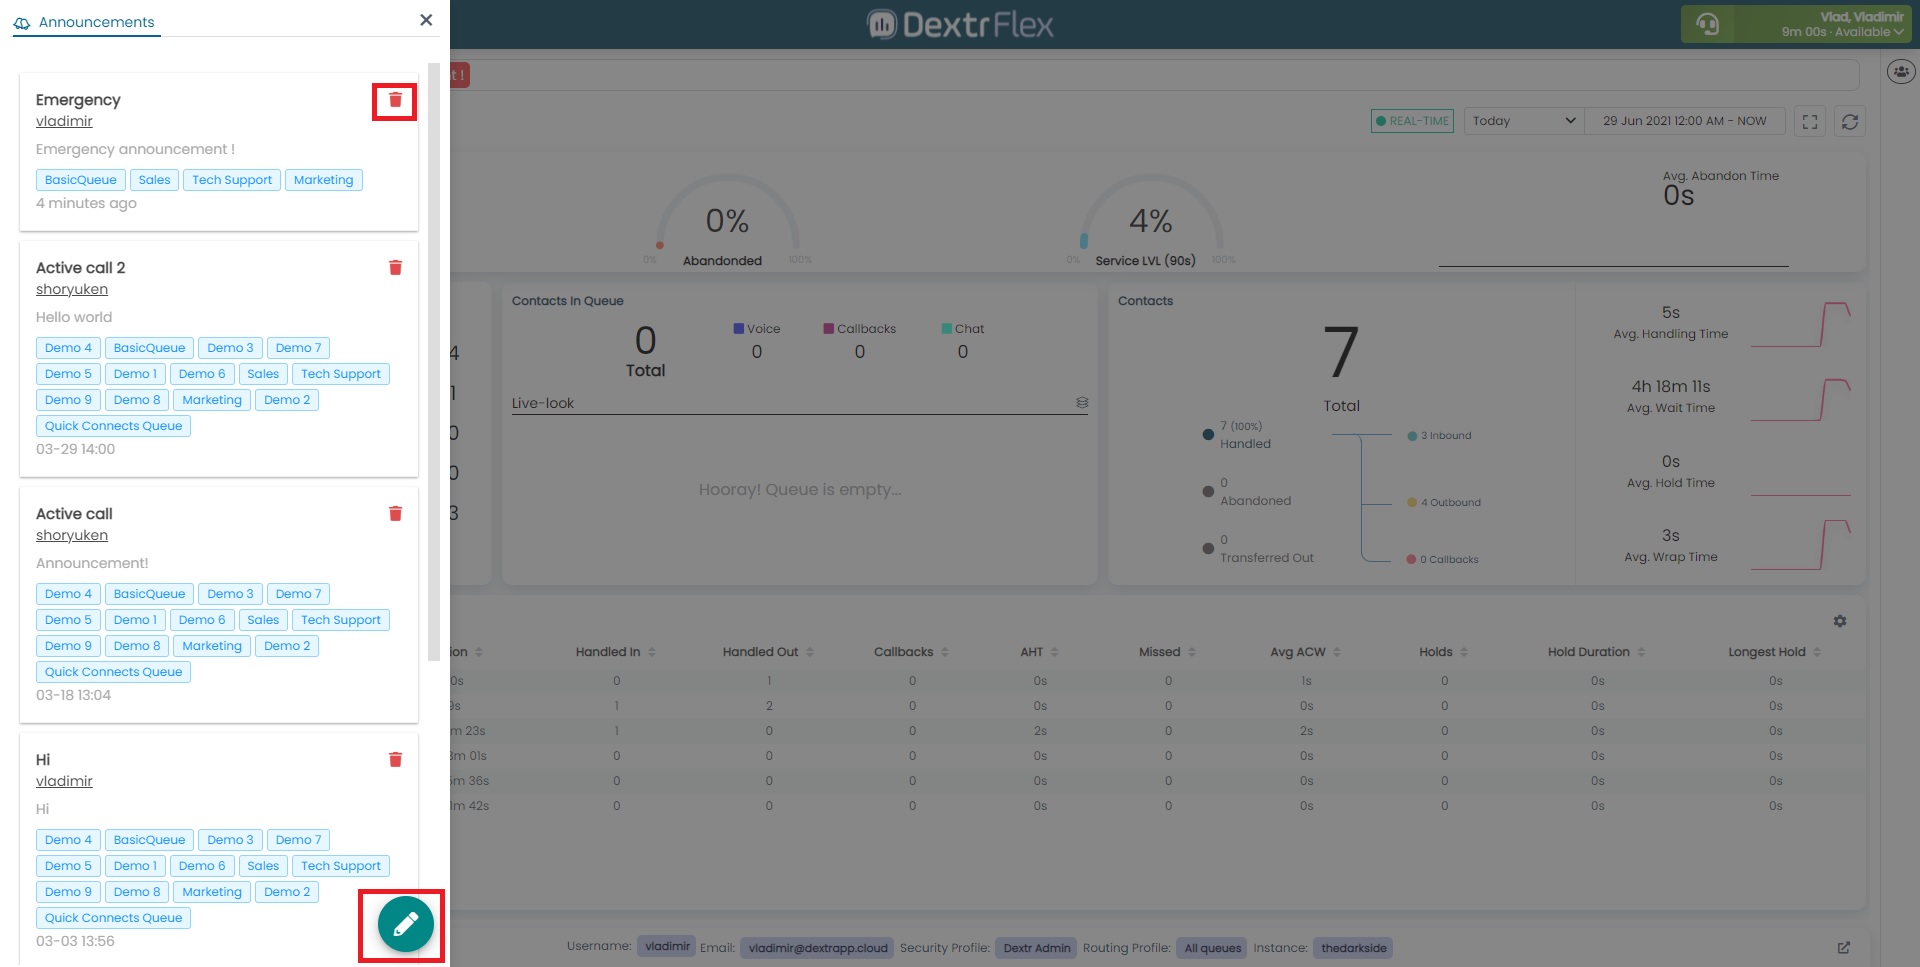
To post an announcement, you need to fill out the Title, select at least one queue, write the body message and choose a delivery method:
- Screen pop delivers the announcement with an incoming dialogue.
- Marquee scroller displays the announcement in a new row just below ConnectPath header.
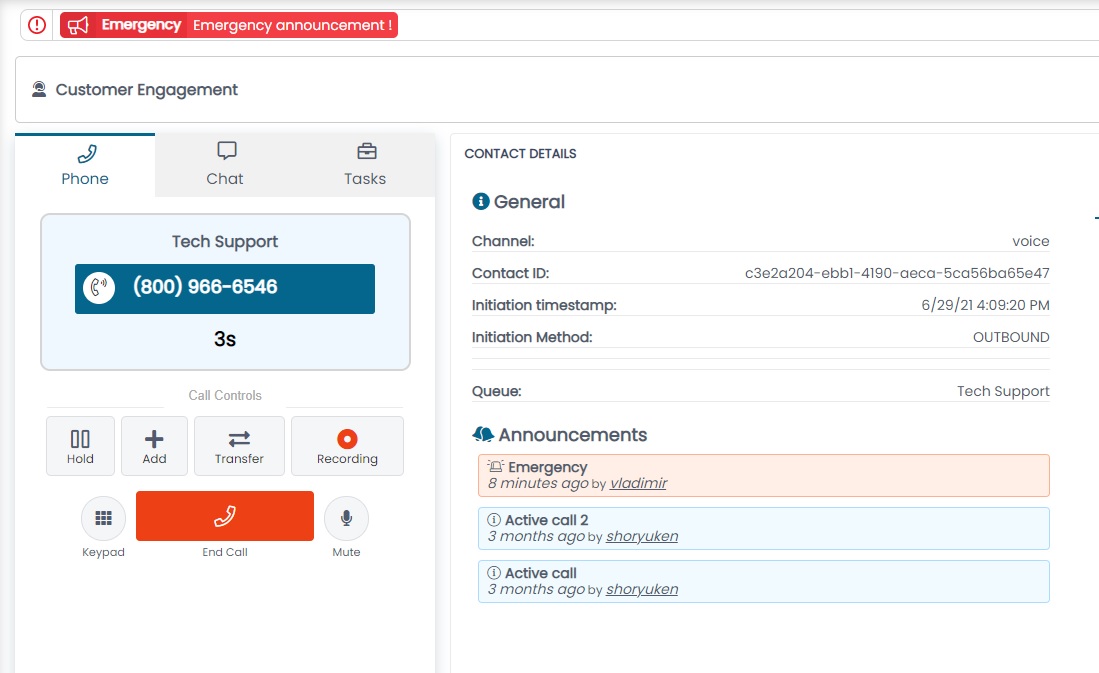
- Active calls displays the announcement when you’re on an active call, in Contact Details.
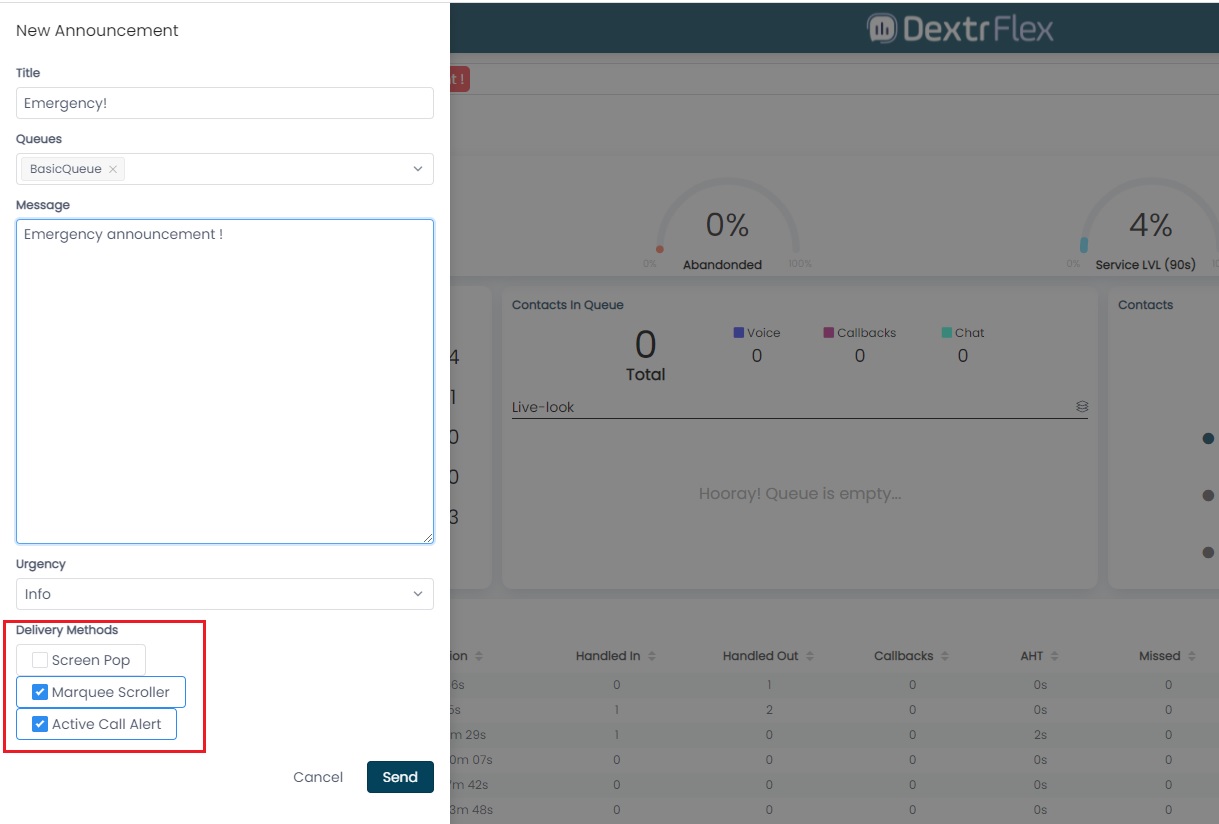
If the Urgency level is Info, when announcements are posted the agents will see the the announcements highlighted in blue, while Emergency will highlight it in red. Clicking an announcement, either in Active call or Marquee will open the announcement drawer in the corresponding post.
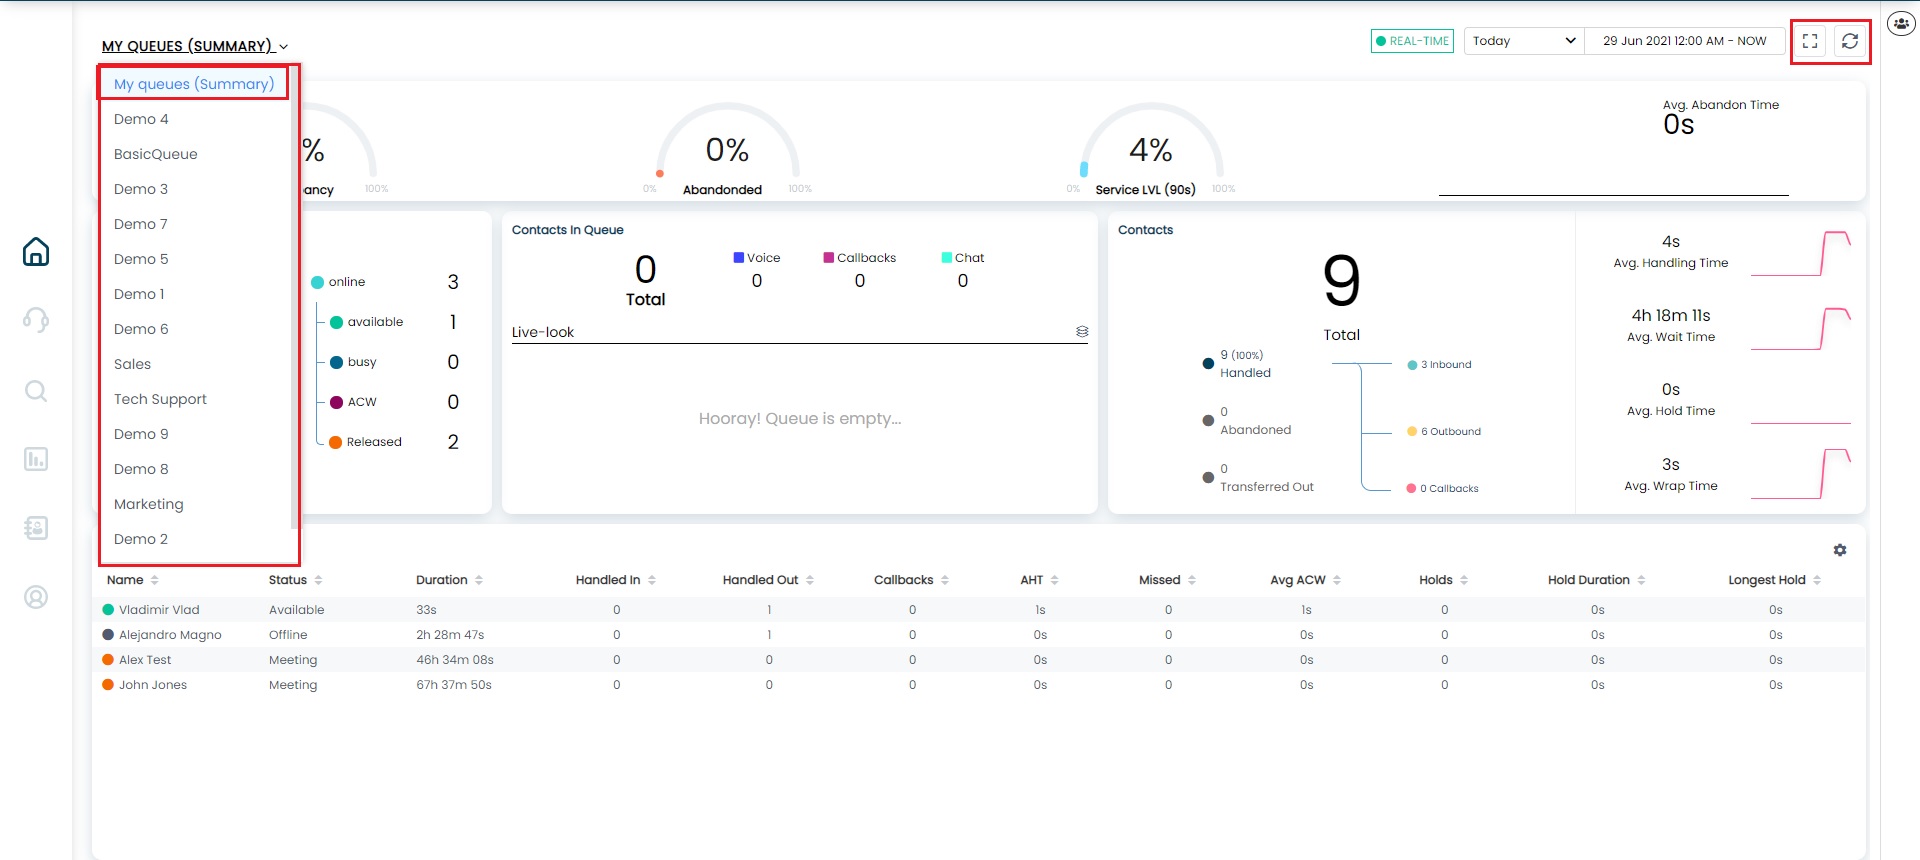
Home Dashboard & Widgets
This area is for the display of real time metrics for all queues in near real time activity. Clicking on a queue name in the dropdown will show the metrics for that queue while the Global view summarizes all queues.
In the top corner of Home dashboard you can also spot 2 icons at the right side, one for entering fullscreen mode and another one to rearrange your card placement.
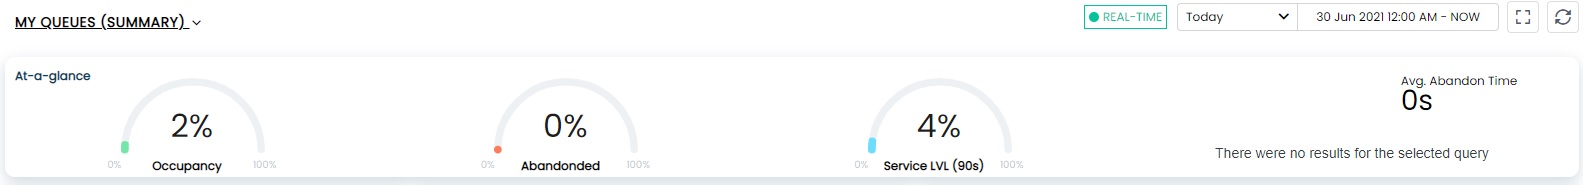
At-a-glance
Displays the first list of metrics, which depends of the selected queue:
- Occupancy: percentage of time that agents were active on contacts.
- Abandoned: percentage of the contacts disconnected by the customer while in the queue.
- Service LVL (90s): percentage of contacts that were removed from the queue between 0 and 90s after being added to it. Contacts are removed from the queue when: an agent answers, the customer abandons the contact, or customer requests a callback.
- Avg. Abandon Time: average time that contacts waited in the queue before being abandoned.
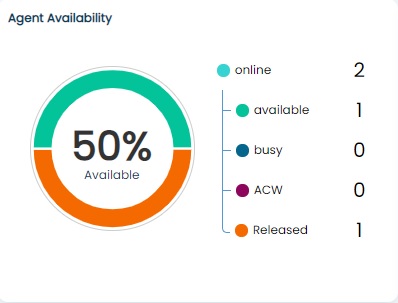
Agent availability
Displays a chart that updates with the number of online agents and their status: Available, Busy, ACW (After contact work) and Released.
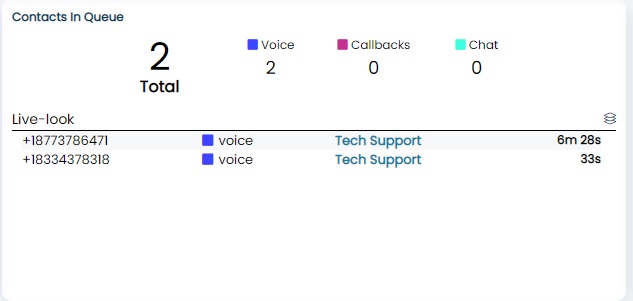
Contacts in Queue
Here you’ll be able to see how many contacts are currently on voice and callback. You’re also provided with a live look that displays the phone numbers and queues.
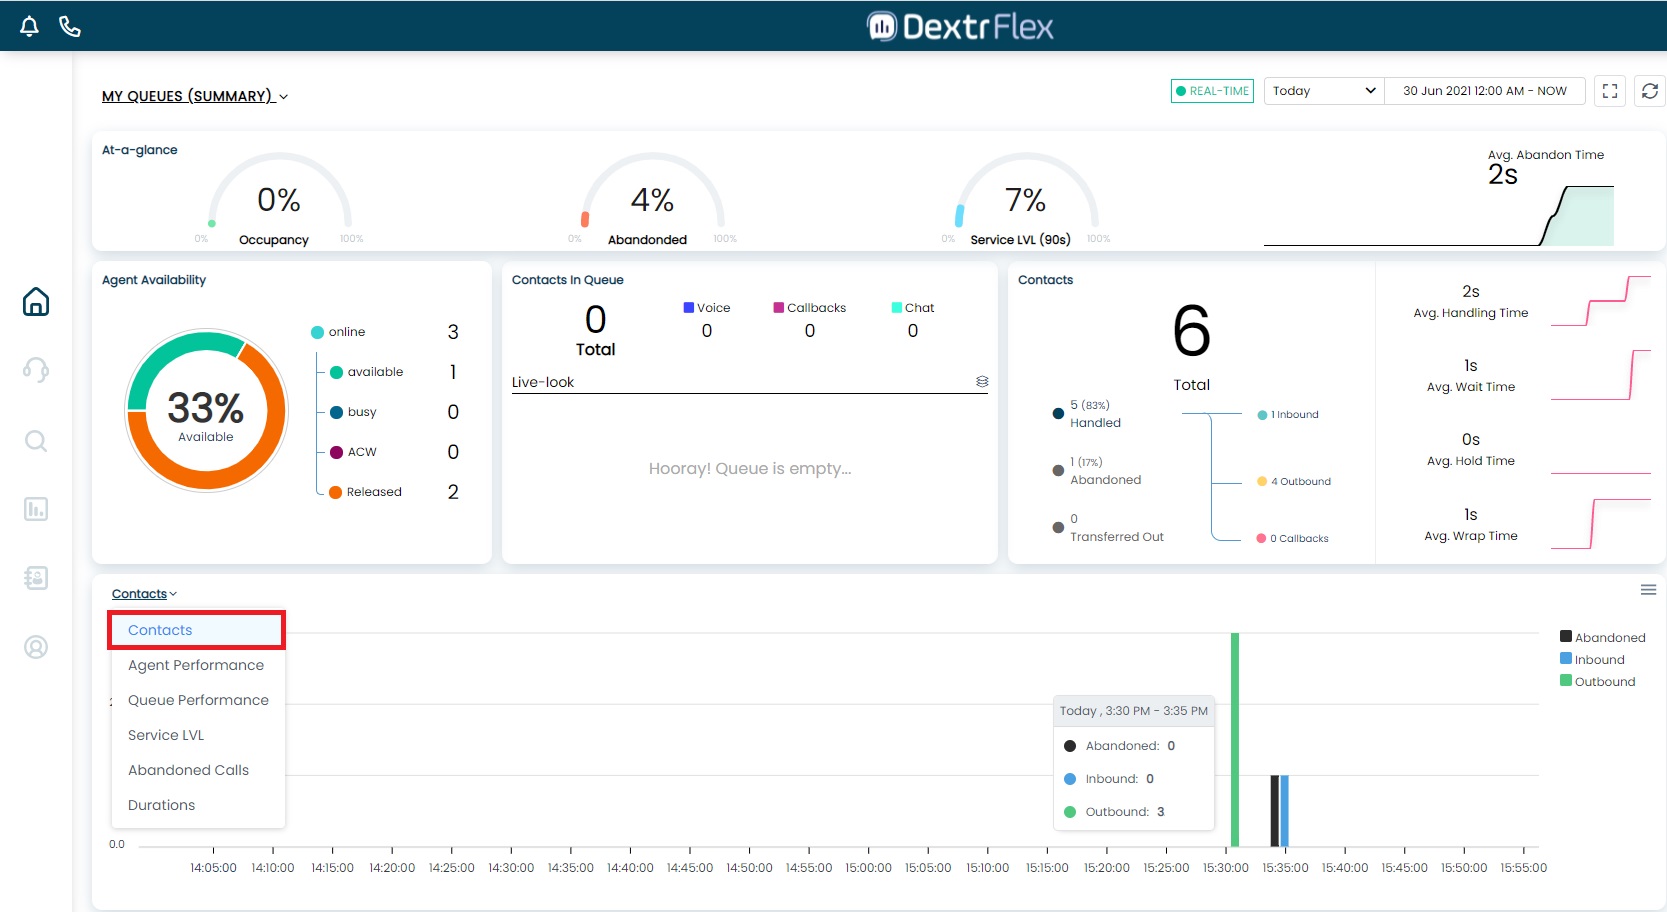
Contacts
This is a Queue widget. You’ll be able to see how many calls have been handled, abandoned or transferred by all team members either globally between all Queues, or in your Queue. It also displays: Avg. Handling Time (average handling time that agents have spent on contacts), Avg. Wait Time (average contact wait time in queue), Avg. Hold Time and Avg. Wrap Time.
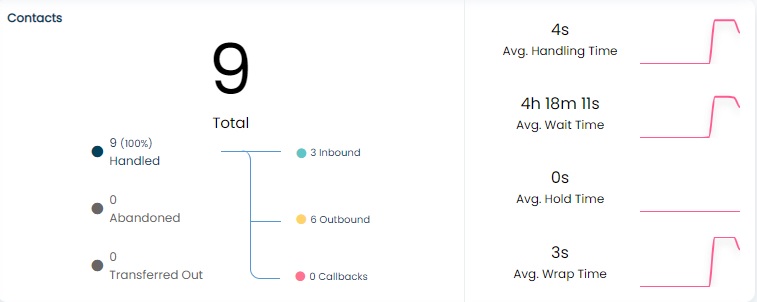
Contacts - Time Series Chart
This is a chart that updates in real time with each call handled by the agents. It shows the number of Abandoned, Inbound and Outbound calls through the day.
Agent Perfomance
Agent Availability is expanded to include all agents in the Instance and their metrics through the day.
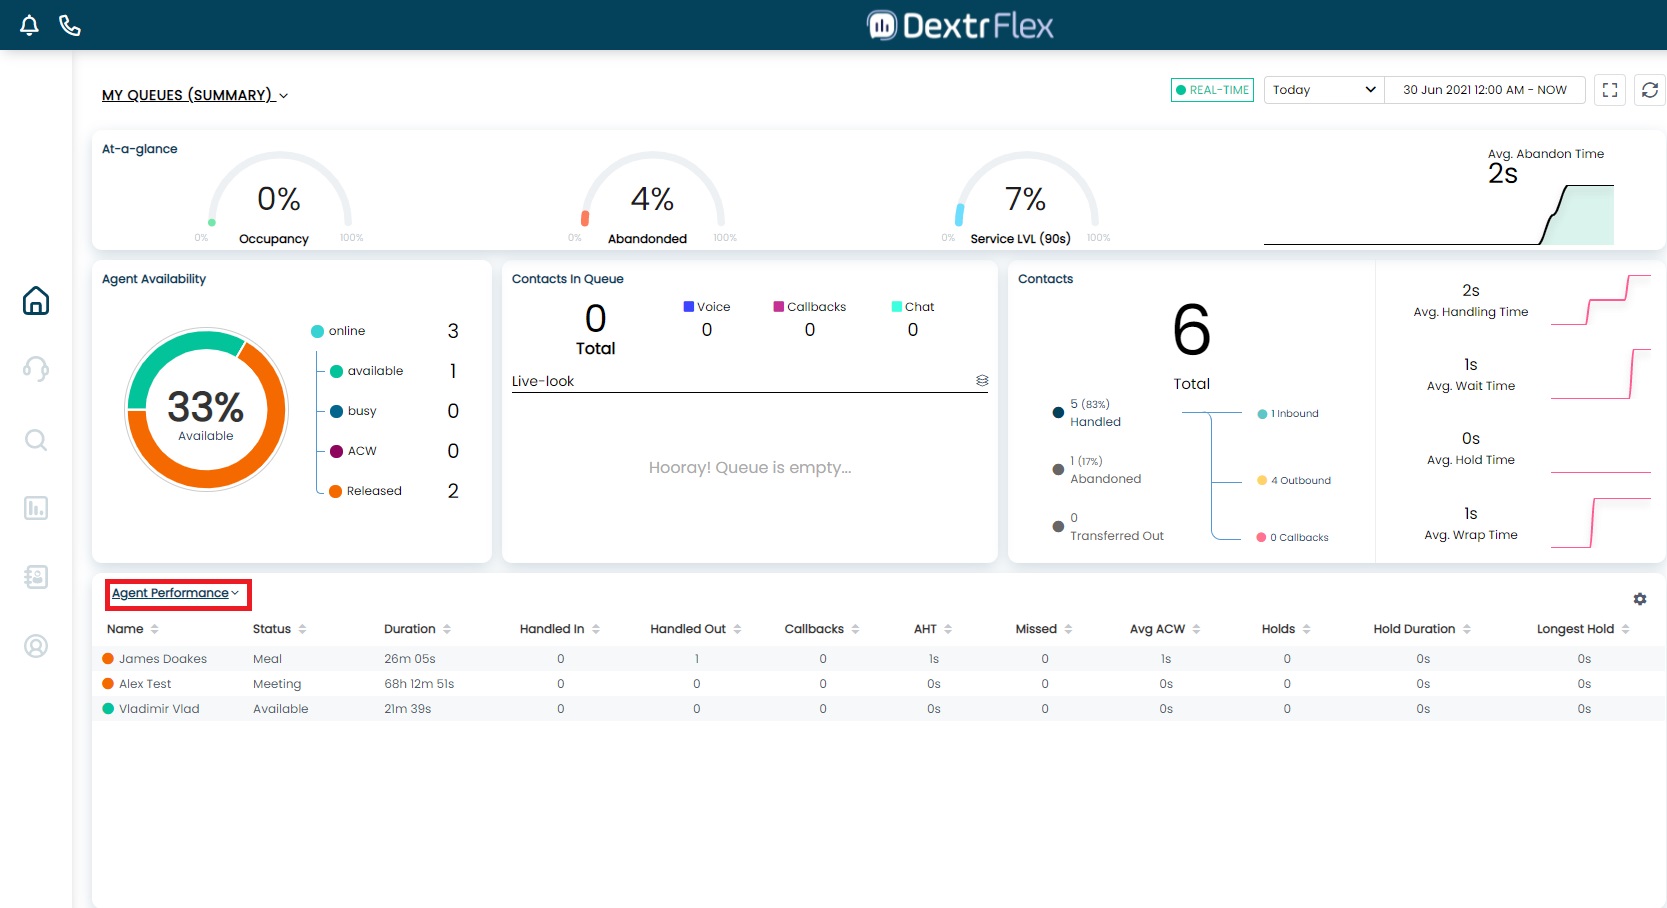
- Handled In, Handled Out, and Handled Callbacks corresponds to the number of Inbound, Outbound and Callbacks handled respectively
- AHT is the average time the agent has been engaged in a call.
- Missed is the amount of missed calls.
- Avg ACW stands for the average time the agent has been in ACW status (after a call ends).
- Holds corresponds to the amount of holds an agent has had through the day.
- Hold duration and Longest Hold, stand for the average time the agent has been on Hold, and the max time the agent has been on hold respectively.
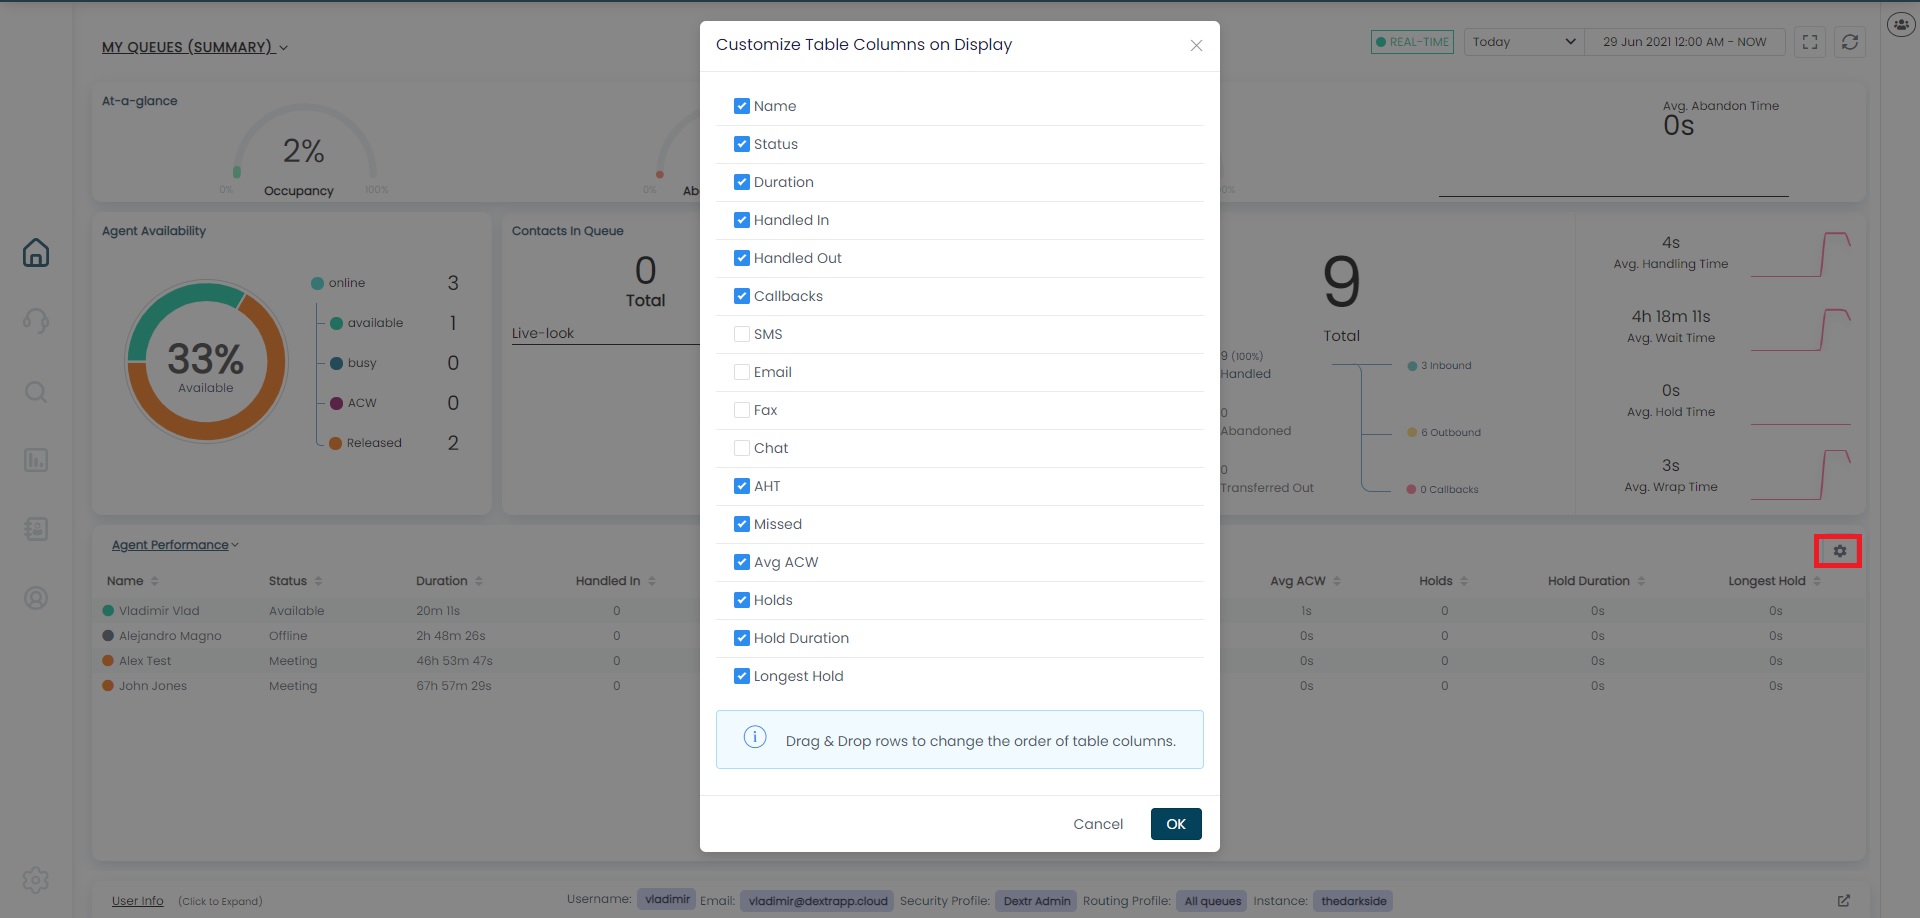
You can filter Agents per status (clicking any status below the chart), or sort them by increasing/descending order, and also customize the table by hiding and changing the order of the columns.
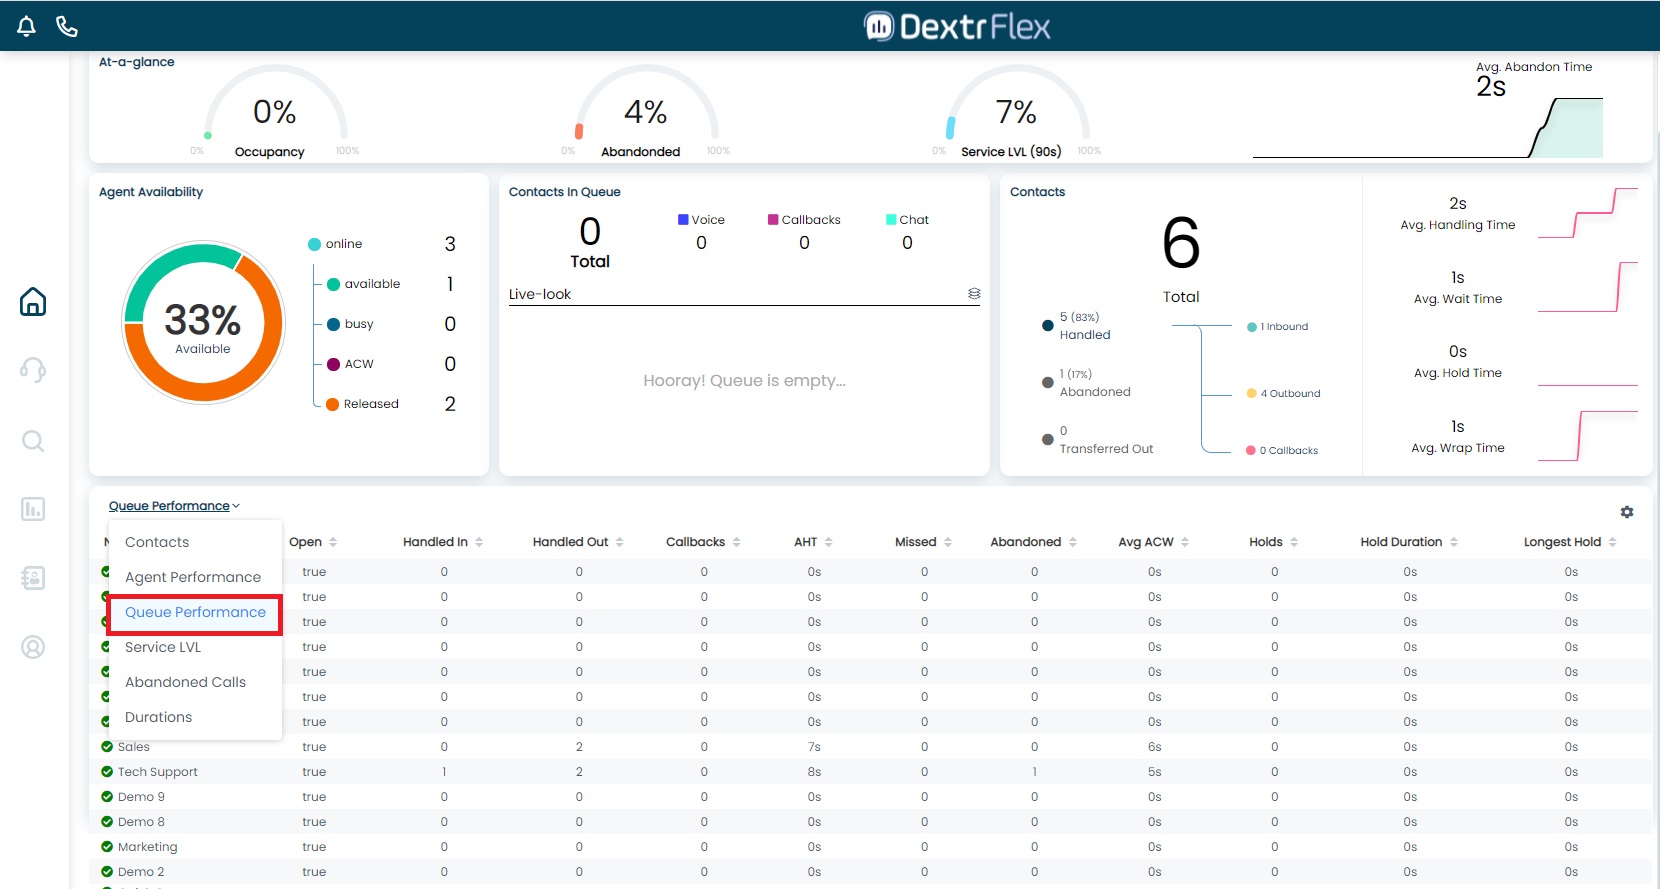
Queue Perfomance
As with Agent Perfomance, this includes all the metrics in the Instance but sorted by Queue. It also has the option to customize the table.
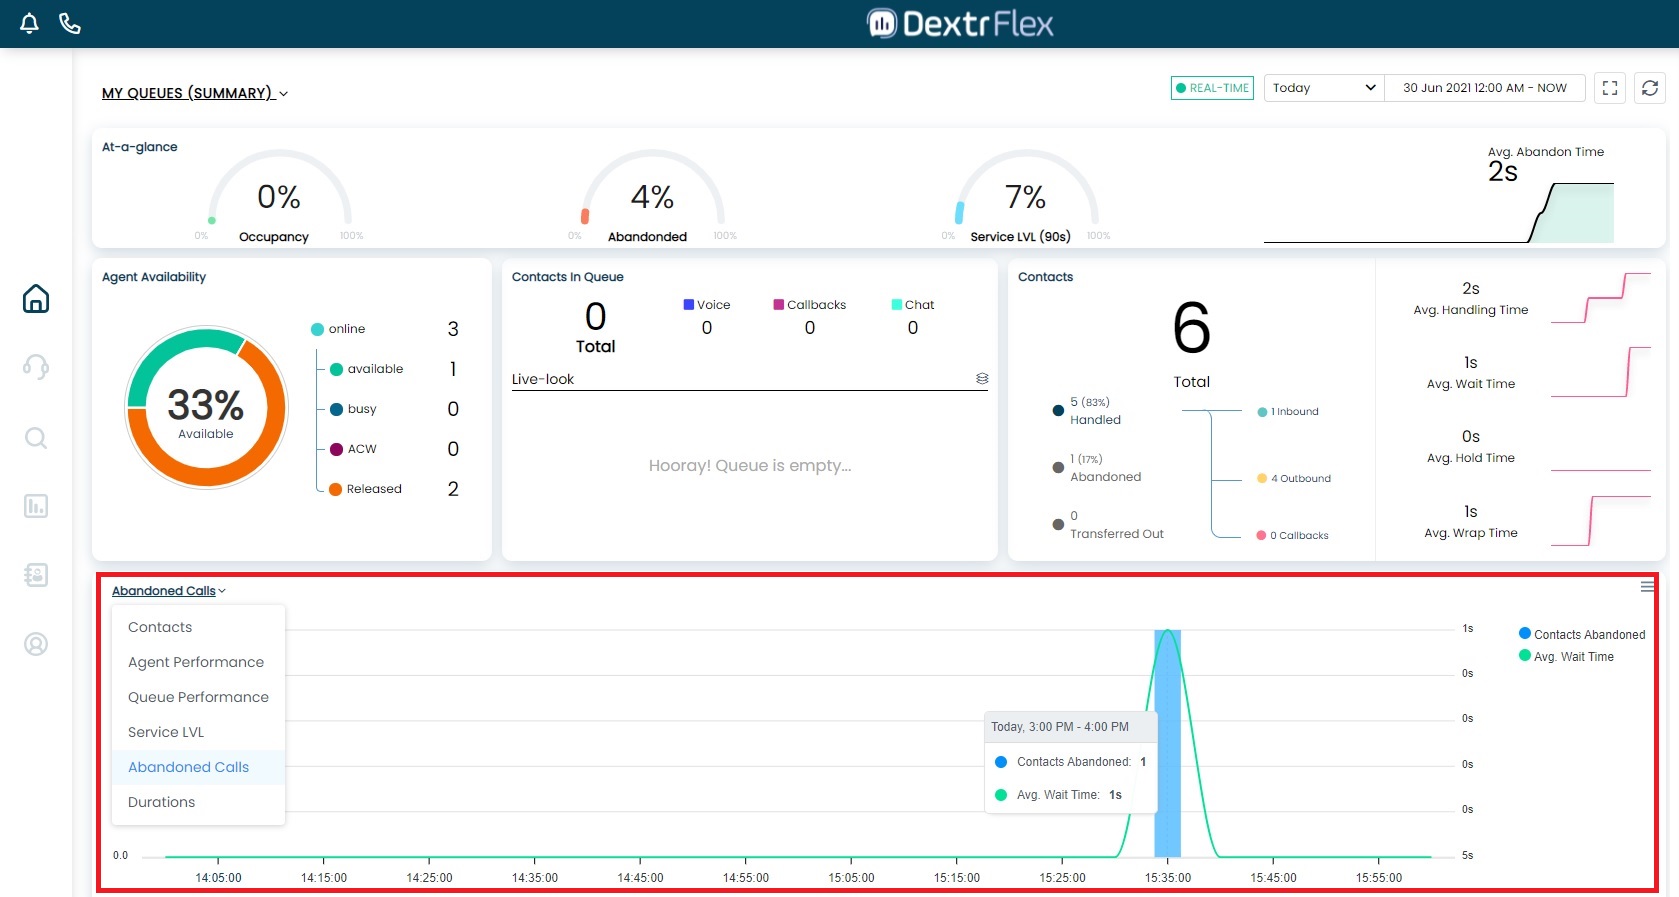
Abandoned calls
This is another form of Time Series Chart that updates with the number of Contacts Abandoned and Avg. Wait Time.
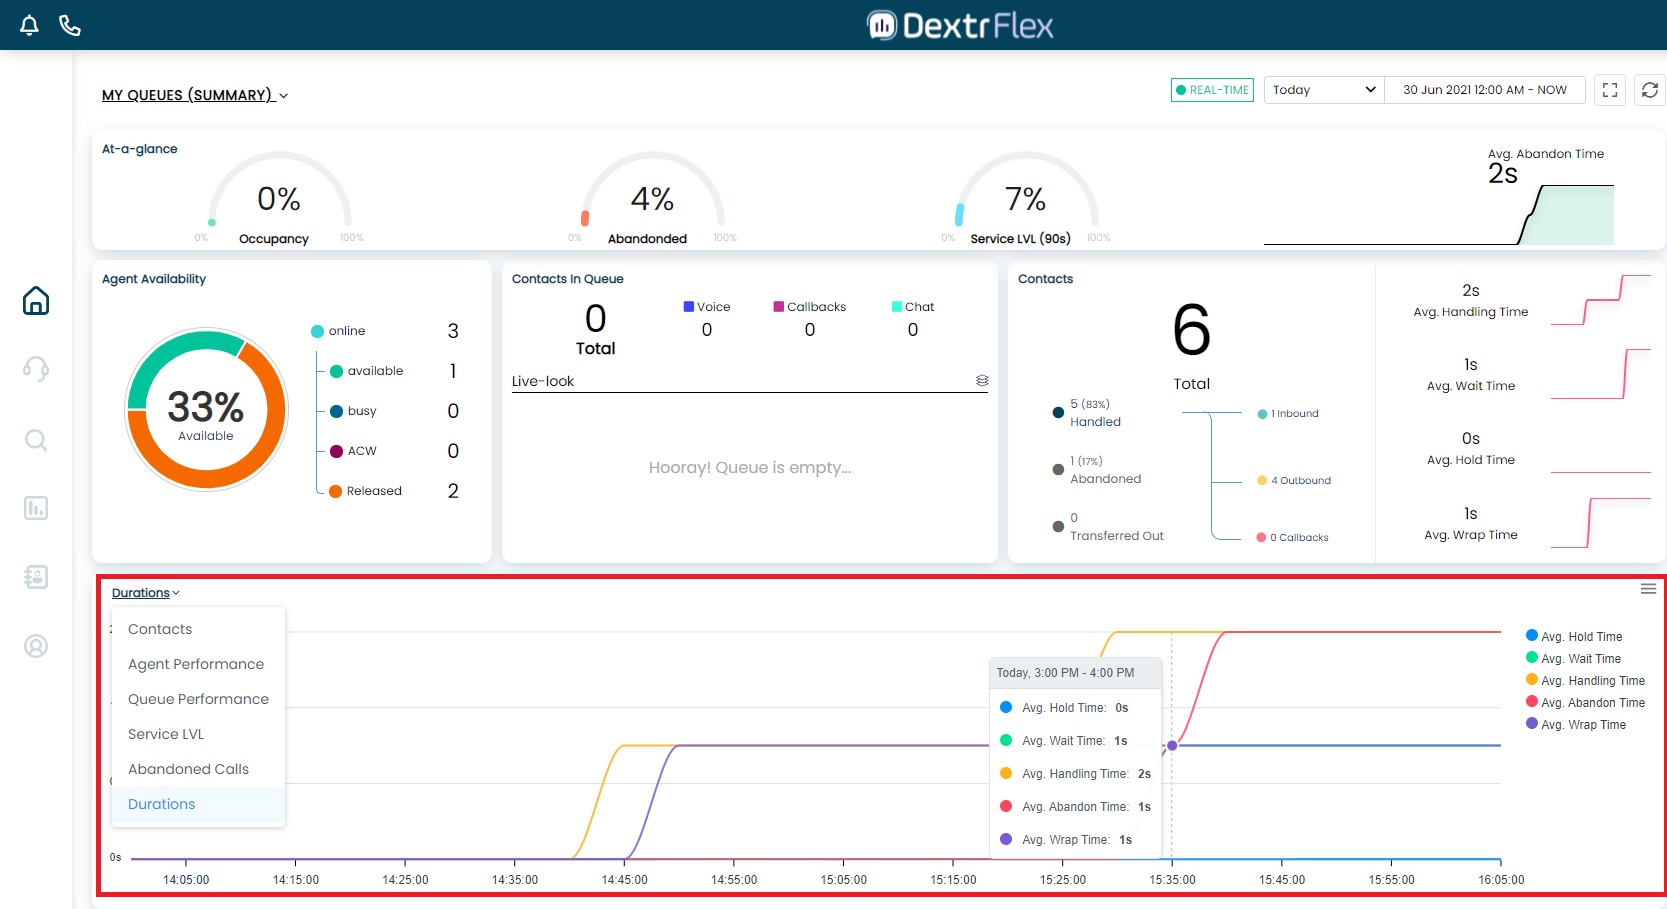
Durations
This is a chart that updates with each of the listed metrics in the right side: Avg. Hold Time, Avg. Wait Time, Avg. Handling Time, Avg. Abandon Time and Avg. Wrap Time.
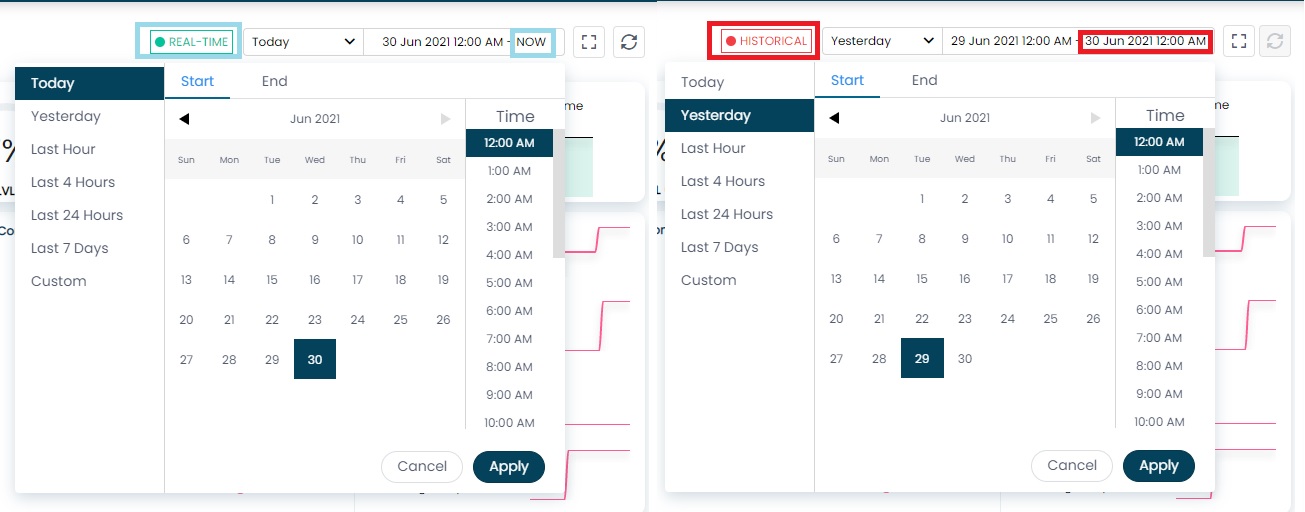
Real Time & Historical Metrics
At the top side of the dashboard you can find a calendar that switches between Real Time and Historical dependent of the query made. All queries that end with “NOW” will be labeled as Real Time, while queries ending at a specific date and hour will be labeled as Historical. These queries will change both the layout and metrics displayed in the dashboard.