ConnectPath Log Generation
As part of the troubleshooting process, you may be asked to provide CCP and/or Developer Tool logs. The logs provide the following types of data:
- CCP Logs – These logs provide logging from when the agent is processing contacts with the application. These are specifically centered around the underlying AWS Connect instance and provide details on “agent Activity” including things like status changes, and errors in the platform when processing contacts. This log also contains call metrics used for diagnosing call quality issues or call errors like Missed calls.
- Developer Tool Logs – These logs provide detailed information about the user’s interactions with the ConnectPath application itself. This includes things like loading metrics into the Dashboards, data created when moving between tabs/screens in the ConnectPath application, and errors that might be generated by the browser.
CCP Log Gathering
The steps below outline how to gather the CCP logs from ConnectPath when requested. Please note that the CCP Logs will reset when a user refreshes their ConnectPath tab, or if they log out and log back in. The CCP logs also overwrite themselves over time (about 45 minutes). For this reason, it is necessary to capture these logs as soon as an issue happens, so the logs are not overwritten.
-
Once they have completed their call, go into a status that will not send you new calls (any status other than Available).
-
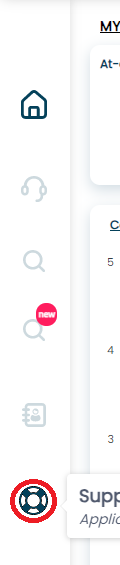
In the left-hand Panel click on the Life Preserver (Support) icon.
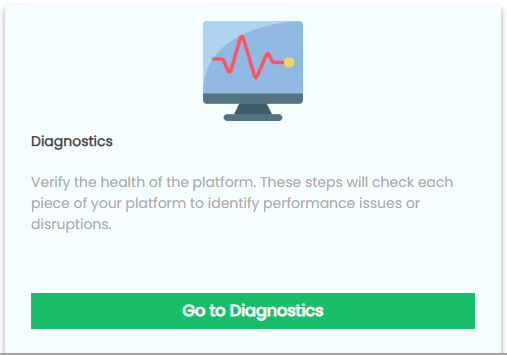
- This will bring you to the support panel. Once there click on the ‘Go to Diagnostics’ button.
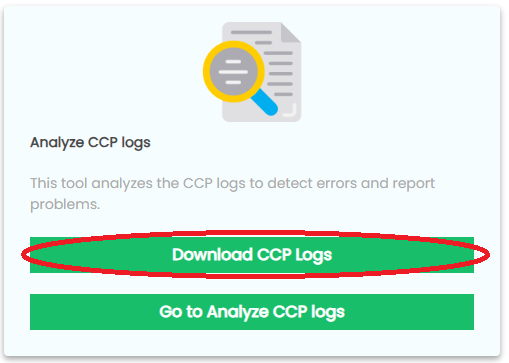
- In the Diagnostics section, click on the button to ‘Download CCP Logs’.
-
This will download the logs to the user’s ‘Downloads’ folder.
-
Have the user send the logs to you. Please rename the file to reflect the Day, Agent and issue. The file will be downloaded to the default download location. Find the file and then attach it to the ticket that has been opened.
-
The user will then put themselves back into an Available status (or refresh the screen or log out and back in if needed to clear the issue).
Developer Tool Log Gathering
-
To get a complete set of developer tool logs for troubleshooting, please do the following: Log off from ConnectPath if already logged on. Close all Connect and ConnectPath tabs in the Chrome web browser. Navigate/relaunch ConnectPath (go.connectpath.cx). Press the F12 key before signing in to your ConnectPath account. This will start the logging and debugging function.
-
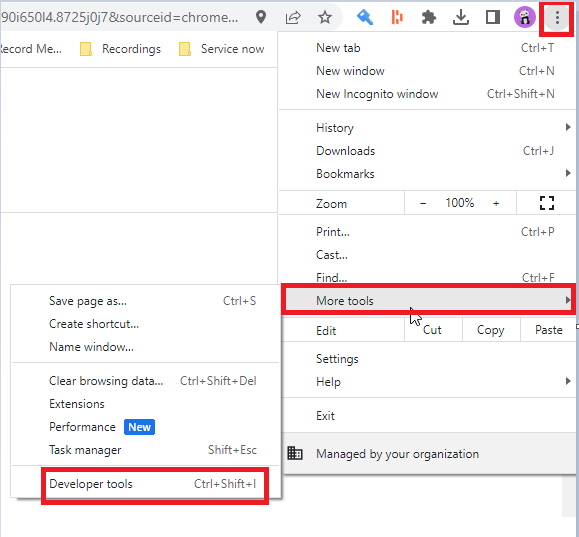
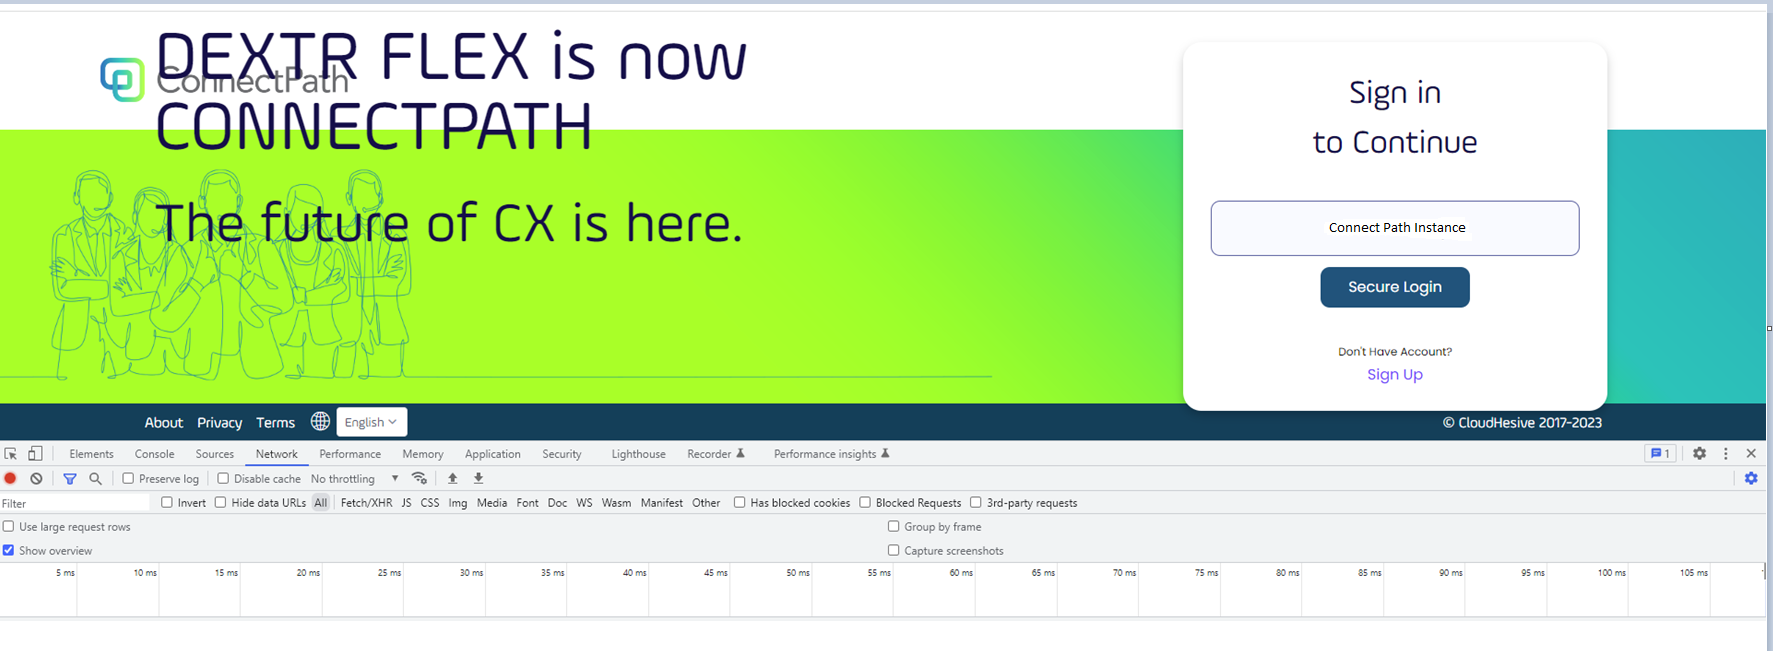
If, for some reason, the F12 key does not launch the Developer Tool pane, please do the following. In Chrome, click the 3 dots in the upper right > More tools > Developer tools. Both methods do the same thing. Please see screen shot below:
- You should now see something like this:
-
Please note the Developer Tool pane may open on the right-hand side as well.
-
The default behavior of the Developer Tool pane is for it to be attached to the browser tab. We recommend that you change this behavior and push the Developer Tool logs to their own window by doing the following:
-
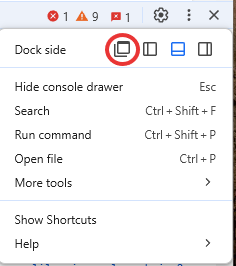
In the Developer Tools pane click on the 3 dots in the upper right of the pane.

- This will open a menu. At the top of the menu you will see “Dock side”; click the icon that looks like 2 windows stacked on each other.
-
This will then open a new window with the Developer Tools and they will no longer be pinned to your browser tab that you launched it in (note that the Dev Tools will only be running for the tab you opened them on; this just undocks the Developer Tools so they do not take up space in your ConnectPath tab). The new window also has its own icon in your applications bar so you can bring it up as needed.
-
You should see a screen like the one below, with several tabs across the top. Console and Network are the logs we need. They are highlighted in red in this screen shot.
-
This setting is permanent, so once set it will always open Developer Tools in its own window.

-
Login to ConnectPath and try to recreate the issue. You should see logs start populating in the log section space that is highlighted in red above.
-
Once the issue is re-created, we can save the new logs.
-
Have the user go into any appropriate non-available state.
-
For the Network logs, click the “Network” tab and then the “Down Arrow” at the top of the tab to export the network logs. This will open the save-as dialog.
-
Save the HAR file to a folder with the date and agent name in the file name.
-
Now click on the Console tab in the Developer Tools. In this screen, right-click on any of the log entries and select Save As. This will open the save-as dialog.
-
Save the Console log to a folder with the date and agent name in the file name.
-
Zip the 2 files up together and attach to the Cloudhesive ticket.
-
The user can now close the Developer Tools window and resume processing contacts.